Create Charts and Apps Right in Chat — Claude's New Feature

Claude is one of the most talked-about AIs right now.
Just a few days ago, a new feature was added that lets you create interactive charts and simple apps directly inside the chat window.
Even if you can't code, just say “show this as a graph” and you're done. It's the perfect way to get a taste of vibe coding before diving in for real.
listContentsexpand_more
- 3 Key Points
- 1. What Is This Feature?
- 2. How Do You Use It?
- Auto-generation
- Direct Request
- Edit Through Conversation
- 3. What Can You Create?
- 4. How Does It Actually Work?
- 5. Example
- Prompt
- Generated Output
- 6. How to Save and Share
- Download vs. Artifact vs. Publish
- What Is Publish?
- 7. Limitations
- 8. How Is It Different from Other AIs?
- Today's Summary
3 Key Points
-
Claude creates charts, diagrams, and visuals directly inside the chat conversation
-
The output supports interactions like clicks and slider controls
-
No coding needed — just say “show this as a chart” and you're done — available on web and desktop
1. What Is This Feature?
NOTE
KNOW — The official name is “Custom Visuals in Chat”
It's a feature where Claude generates charts, diagrams, and widgets directly within its text responses.
In online communities, it's also known as the “Show Me” feature.
Claude already had a feature called Artifacts.
Artifacts let you create apps, documents, and tools in a side panel that can be permanently saved and shared.
This new inline visual feature has a different purpose:
| Inline Visuals (New) | Artifacts (Existing) | |
|---|---|---|
| Location | Inside the chat window | Side panel |
| Usage | Temporary — changes or disappears as the conversation flows | Permanent — can be saved, shared, and downloaded |
| Purpose | Explanatory aid to enhance understanding | Creating finished outputs (apps, docs, tools) |
2. How Do You Use It?
Auto-generation
No special setup needed. It's on by default.
If Claude decides “a visual would be clearer than text” based on your request, it will automatically generate one.
Direct Request
Just say something like:
-
“Draw this as a diagram”
-
“Visualize how this changes over time”
-
“Turn this data into a chart”
NOTE
There's no special command
“show me” or “chart this” aren't dedicated trigger phrases.
As long as your message conveys the intent to “visualize something,” Claude will figure it out.
Edit Through Conversation
Generated visuals support clicking, slider controls, and full-screen expansion.
You can also request changes like “switch from monthly to yearly” or “change the color” right in chat.
3. What Can You Create?
-
Compound interest curves — adjust interest rate and duration with sliders in real time
-
Interactive periodic table — click an element to expand its details
-
Process flowcharts — complex procedures turned into automatic diagrams
-
Data analysis — upload a CSV file and generate interactive charts
-
Option comparisons — visualize two choices side by side
-
System diagrams — understand complex structures at a glance
-
Weather & recipes — visualize real-time data with web search integration
-
And many more visual materials and simple apps
4. How Does It Actually Work?
This feature is not AI-generated imagery like Nano Banana or Midjourney.
It works by writing code in real time — just like building a web page — and rendering it on screen.
-
Image AI → generates a static image made of pixels
-
Claude inline visuals → generates dynamic output built with code
Because it's code-based, the result is interactive and accurately reflects exactly the data you specify.
5. Example
Prompt
Show me easy-to-understand visuals and interactive graphs showing the stock price movements of the S&P 500, Nikkei 225, and KOSPI from January 2020 through March 2026.
TIP
For this example, an actual stock index data file was attached separately along with the prompt.
When accuracy matters, it's better to provide the data yourself rather than asking AI to look it up.
Generated Output
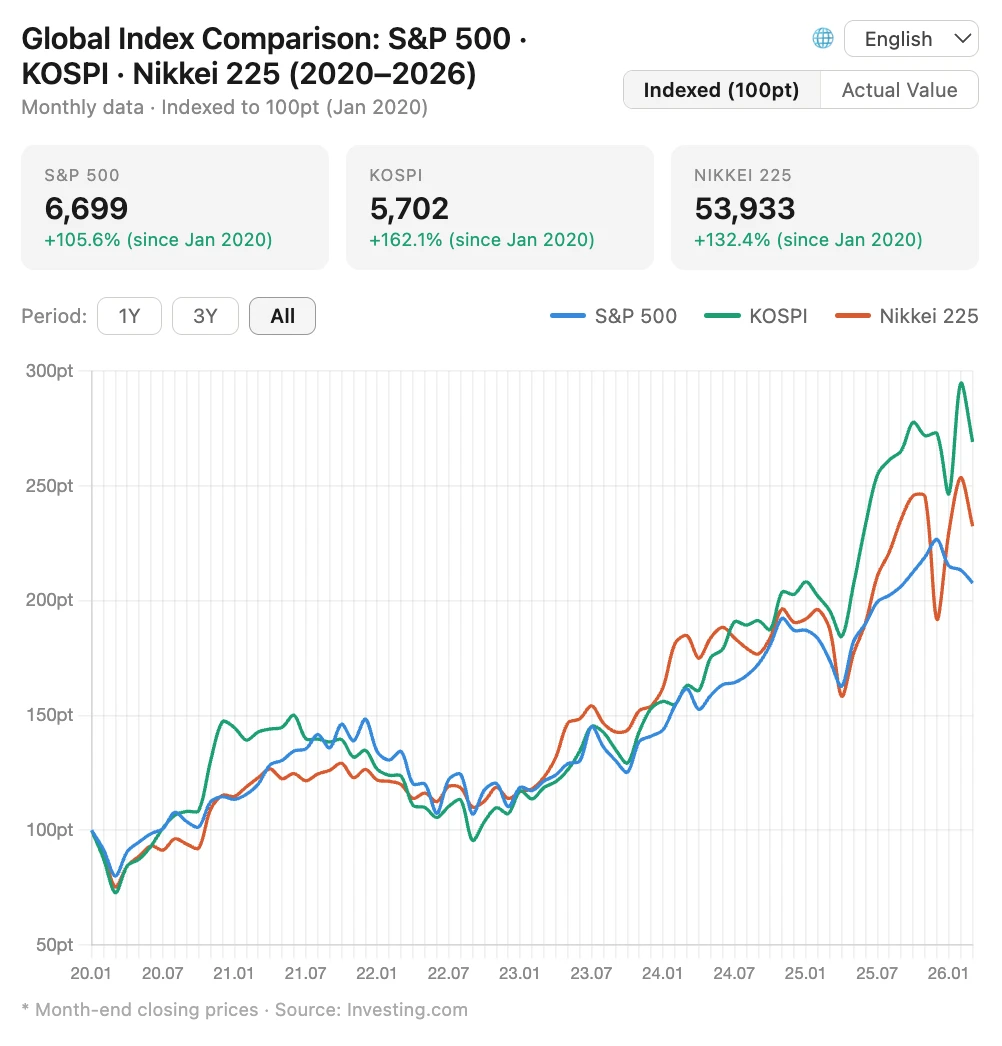
You can interact with the example at the link below.
→ https://claude.ai/public/artifacts/c91dc3b5-fc82-4991-b7a5-9e2a0312232a
6. How to Save and Share
If you need to preserve or share your output, use one of these methods.
| Method | Description | Best For |
|---|---|---|
| 📋 Copy to clipboard | Copy as an image file | Quickly pasting into notes or slides |
| 💾 Download file | Export as .svg / .html | Uploading to the web or saving locally |
| 📌 Save as artifact | Permanently store in Claude's side panel | Continuing to edit and develop within Claude |
| 🌐 Publish | Create a public link (viewable without an account) | External sharing, portfolios, social media |
Download vs. Artifact vs. Publish
The output itself is nearly the same. The difference is just “where you plan to use it.”
Want to keep refining it in Claude? → Save as artifact
Want to use it as a file elsewhere? → Download
Want a public link anyone can open? → Publish
What Is Publish?
When you publish an artifact, a public URL in the format claude.ai/public/artifacts/... is generated.
Anyone can open it by clicking the link — no Claude account required.
(Example) https://claude.ai/public/artifacts/c91dc3b5-fc82-4991-b7a5-9e2a0312232a
How to use:
-
Open the artifact you want to share in the artifact panel
-
Click the “Publish” button
-
Copy the generated public link and share it
7. Limitations
WARNING
NO — It's a beta feature, so there are still some limitations.
- No mobile support — only available on web and desktop (not supported on iOS/Android apps)
- No auto-save — if you don't save, the visual may disappear as the conversation moves on
- Quality varies — results may differ in polish depending on the use case
- Not always generated — if Claude decides “text is better,” it may not create a visual
8. How Is It Different from Other AIs?
Each AI takes a different approach to visualization. Since each has its own strengths, it pays to pick the right tool for the job.
| Service | Visualization Method | Strengths | Limitations |
|---|---|---|---|
| Claude | Code-based inline rendering | Interactive charts and diagrams within conversation | No image generation, no mobile support |
| ChatGPT | Python code → image + DALL-E image generation | Data analysis and statistical visualization, AI image generation | Generated charts are static images — not interactive |
| Gemini | AI image generation + text | High-quality image generation (Nano Banana, etc.), long document processing | No support for interactive code-based visualization |
In summary: Claude excels at interactive visualization, ChatGPT at data analysis charts, and Gemini at producing long, detailed documents.
No single AI is great at everything — the key is knowing which one to reach for.
Today's Summary
-
Key concept: Inline visuals = temporary visualization within conversation / Artifacts = permanent finished output
-
Practical tip: Attaching data yourself improves accuracy; to save output, use artifact → then publish
-
Pros & cons: Code-based visuals that support clicks and interactions are a big strength, but no mobile support and relatively high usage consumption
NOTE
NOW — Try it right now
- Go to claude.ai (web or desktop app)
- Ask about anything and add “show this as a chart” or “draw it as a diagram”
- Click and interact with the generated visual, then try a follow-up like “change the color”
- If you like it, save it as an artifact or publish it to share